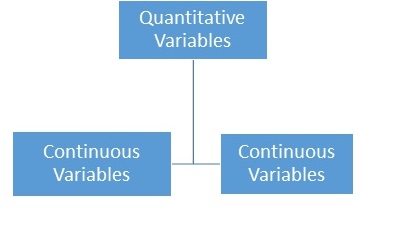
PROC CORR is used for performing Correlation Analysis and originates from the word Correlation. It focuses on the measure of the strength of the linear relationship between two continuous variables. Let’s recall that continuous variables are a subset of quantitative variables and that they store numerical data that is measured on a scale that has an infinite number of values containing no breaks such as 234, 234.6 and 235.0.
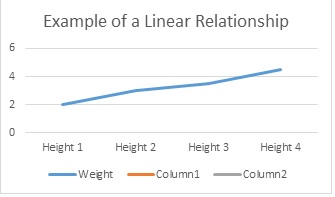
The relationship or association between two continuous variables can be parabolic, curvilinear, quadratic, cyclical or random among others but PROC CORR is primarily focused on the linear relationship between two continuous variables.
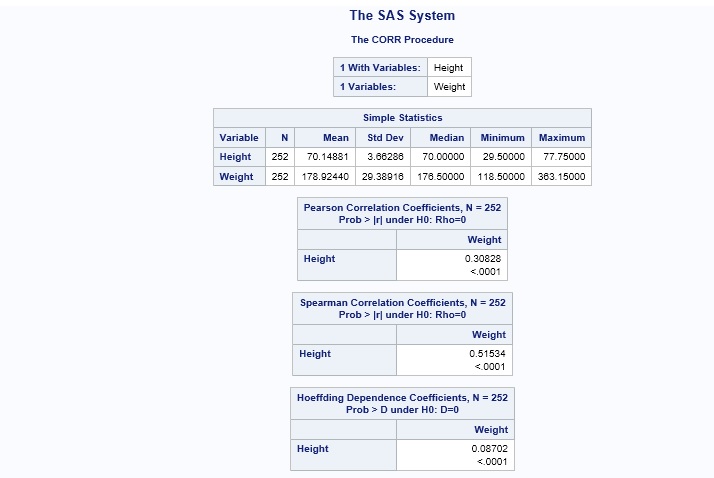
According to the SAS Product Documentation, PROC CORR computes the following information:
It is important to stress that correlation analysis of two variables does not define a cause-and-effect relationship. That is, the existence of a linear relationship between two variables does not mean that one variable has an effect on the variable. The primary concern of correlation is the measurement of the degree of the linear association.
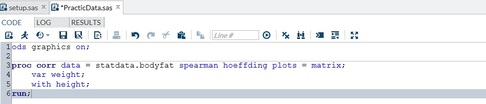
Now, let’s get our hands dirty and dive right into PROC CORR and how it can be used to demonstrate the linear association or relationship between two continuous variables. The following SAS code obtains correlation statistics for the variable PctBodyFat1 and each of the variables Age, Weight and Height.
- Tables of variable information
- Simple descriptive statistics for each variable
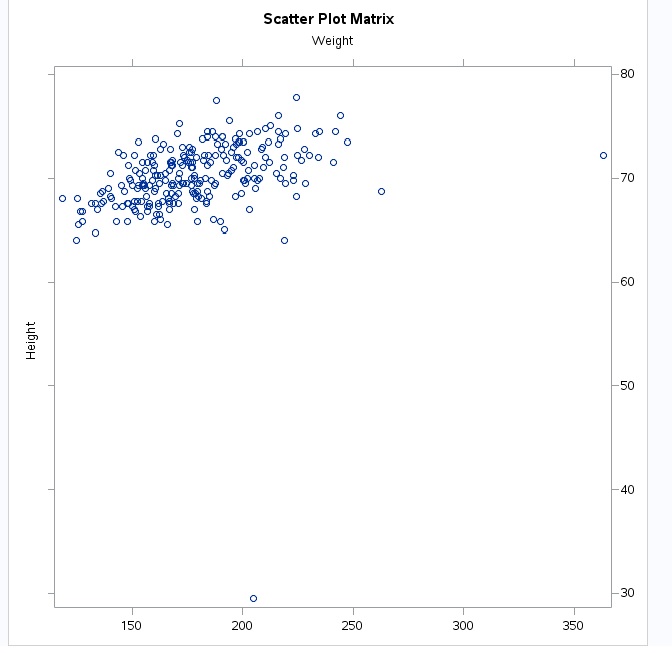
- Scatter plots
- Scatter plot matrices
- Pearson Correlation Coefficients
- Pearson product-moment correlation
- Pearson product-moment correlation
- 3 nonparametric measures of association
- Spearman rank-order correlation
- Kendall’s tau-b coefficient
- Hoeffing’s measure of dependence, D)
- Spearman rank-order correlation
- Pearson, Spearman and Kendall partial correlation
It is important to stress that correlation analysis of two variables does not define a cause-and-effect relationship. That is, the existence of a linear relationship between two variables does not mean that one variable has an effect on the variable. The primary concern of correlation is the measurement of the degree of the linear association.
Now, let’s get our hands dirty and dive right into PROC CORR and how it can be used to demonstrate the linear association or relationship between two continuous variables. The following SAS code obtains correlation statistics for the variable PctBodyFat1 and each of the variables Age, Weight and Height.
 RSS Feed
